Follow these instructions to create a new report:
| 1. | Select a Report Branch (ie. Payroll, Payables, etc) and then select the New option. Answer 'Yes' to use the company database connection. |
| 2. | The Design Canvas will be displayed. |
| 3. | Select the Data Tab. |
| 4. | Click File > New > Query Wizard to select the database(s) to be used. |
| 5. | From the Query Wizards screen, select the table from the list of Available Tables on the left side of the screen. If selecting only one table, click Next, otherwise choose the second table. When selecting multiple databases, the general rule of thumb is to start with a master list, such as clients.adt or Joblist.adt, and then add a detail table such as jobdetl.adt (detail job cost transactions). |
| When multiple tables are selected, the tables must be joined together based on a common field. The Joint Table screen will show the fields that the system finds that both tables have in common. Link the tables together by the primary fields only such as Job or Job and Phase. All other non-primary links (ie. DosImportRecord) can be removed by double-clicking on the field. |
| The field that links the two tables together MUST be joined with a Left Outer join type at the top of the screen. |
| 6. | Click Next. |
| 7. | Click on the Choose Fields option to display a list of all fields in the selected table(s). Double-click on each field that you wish to view on the report. |
| 8. | Click Next on the calculations screen. Formulas can be created on the Data Tab later. |
| 9. | Click Select Group Fields if you want to define a group(s) for the report. Groups will allow you to create subtotals for each group, if desired. The order in which you select the fields will determine the hierarchy for the groups themselves. For example, if you select the field Job and then the field Phase, then the top grouping will be by job followed by sub grouping of phases below each job. If you do not wish to create a group at this point, select No Grouping. You can create groups later on the Design Tab. |
| 10. | Click Next on the search criteria screen. Filters for data can be created on the Data Tab later. |
| 11. | Click on the Set Order option and choose the fields by which to sort the report. |
| 12. | Click Finish to complete the data query selection. |
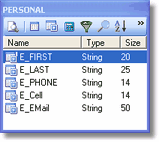
13. The query wizard will close and a floating screen of the selected data query fields will be displayed.

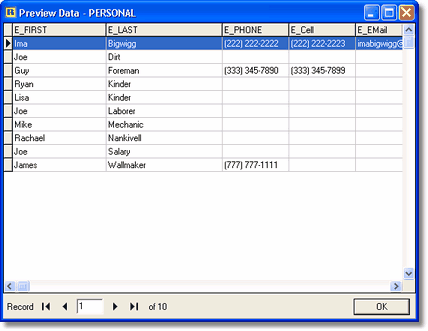
| 14. | You can preview the data at this point by clicking on the Preview icon (the first icon in the row). The data will be displayed in a tabular format similar to a spreadsheet. |

| 15. | Click on the Design Tab to begin the report layout process. |
| 16. | Choose File > New from the menu, and then select the Report Wizard option. |
| 17. | Select the fields that you want to place onto the report and click Next. |
| 18. | Click Finish to complete the report design. The report wizard will automatically layout the report design. |
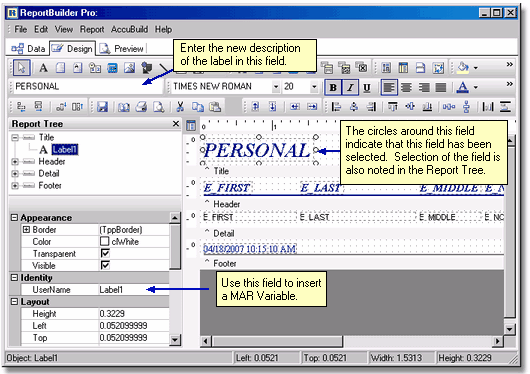
| 19. | Click on the Preview Tab to display your report. Notice that the various label fields (report name, column headings, etc) will need to be modified to suit your needs. Simply click on each field and change the description of the label in the top left corner of the screen. MAR Variables can be inserted by changing the UserName field property on a label. |
Other cosmetic changes such as font style, size and appearance can be easily changed for any field on the report. Placement of the fields can be changed by dragging a field to a new location or by using the Nudge, Align, or Space Toolbar's.

| 20. | Be sure to save your report. If your report is created under the My AccuBuild Reports option, then the report will be saved under the Report Branch that was originally selected before you created a new report. Permission can be granted to other users to access your report through the Properties Button on the MAR Screen. |