Buttons on Grid Tab
When a Cube is selected, the data is displayed in the grid based on Dimensions and Measures.
•Dimensions are the values that you want to use for analyzing the data.
•Measures are the sums, count or other statistical measure that you are seeking based on the criteria in the dimensions.
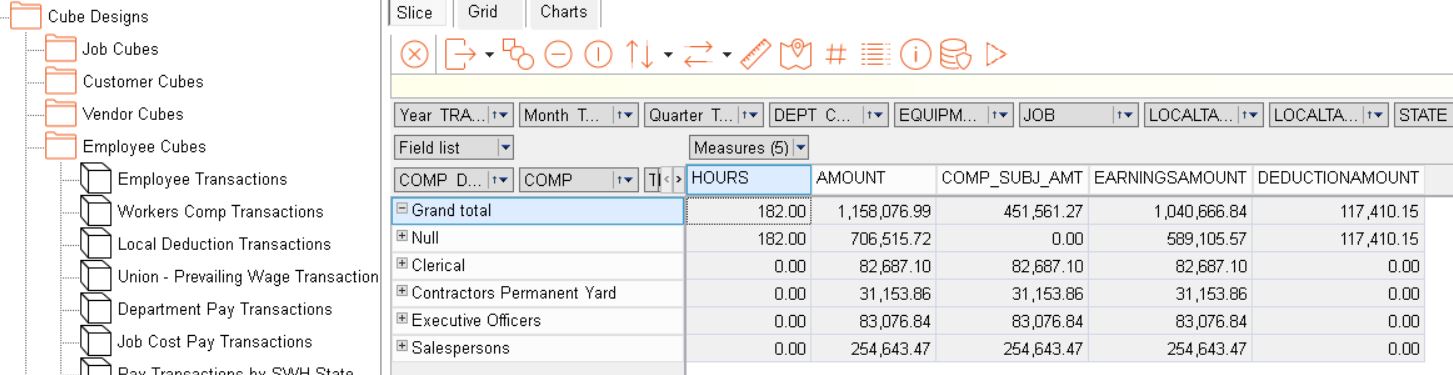
As an example, take a look at the following Workers Comp Transactions Cube. The Dimensions appear on the left; the data is being grouped by the workers comp code. The Measure of time card Hours, Amount, Subject Wages, Earnings and Deductions appear as columns on the right side of the grid. These columns are summing the values for each workers comp code. A drill down on the workers comp code would show that there are further dimensions (groups) that are being calculated for transaction type and employee name. Therefore, the grid on the right would provide additional measures (sums) of the sub groups if they were being displayed.