The Chart Editor Screen contains features that will affect the overall appearance of the chart. They include color, titles, margins, borders, etc.
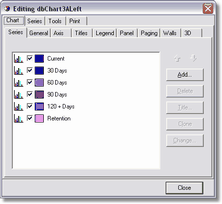
Chart Tab
•Series Tab - Defines the Chart Style
•General Tab - Includes Margin Settings & Print Preview
•Axis Tab - Controls the visibility and appearance of an axis' title and label.
•Scales Tab - Controls the visibility of each axis.
•Title Tab - Add a title to an axis
•Labels Tab - Controls the visibility and appearance of the labels on the chart. Control the rounding of numbers on a label utilizing this option.
•Ticks Tab and Minor Tab - Controls the appearance of the 'grid' on the chart.
•Position Tab - Change the position of an axis' titles and labels
•Titles Tab - Defines and controls the chart title (description).
•Legend Tab - Controls the visibility and appearance of the chart legend which automatically appears on the right side of the chart.
•Panel Tab - Controls the background color or image and borders.
•Paging Tab - Controls the number of items that will be displayed on each page of a chart. For example, if your chart displays jobs, you may choose to display up to 10 jobs per page of the chart.
•Walls Tab - Controls the visibility and appearance of the 'walls' that give the chart the dimensional affect.
•3D Tab - Controls the appearance of the 3D view of the chart.
Series Tab
This tab contains a variety of options to control the appearance of the data that appears within the chart. For example, if you have a bar chart that shows the earnings of each job, you may change the 'bar' that represents each job from a rectangle to a pyramid.
Print Tab
This tab contains options for printing the chart as an image.